Update 15 Jul 2009, 18:17 - Updated with values from today's trading; should be ready to go for Thursday. (link) Sorry it took a while. Note: simple moving average and Bollinger band data NOT updated. Given the size and scope of the rally, I may update these at some point tomorrow - old Bollinger data is unacceptable when an ETF begins riding it up/down.
Update 15 Jul 2009, 11:25 - Updated with values from yesterday's trading. Sorry it took a while. Note: simple moving average and Bollinger band data NOT updated, but should be acceptable for the rest of this week.
Update 13 Jul 2009, 19:22 - Updated with values from today's trading. Note: simple moving average and Bollinger band data NOT updated, but should be acceptable for the rest of this week.
I've updated my custom ETF spreadsheet that covers a ton of sectors, asset classes, and related Proshares/Direxion leveraged and inverse ETFs, where available.
Refer to my earlier post for instructions on how to read/interpret the spreadsheet. Do let me know if you note any errors, or would like to see changes.
NOTE: The pivot-based levels are calculated based on the previous trading day's range, and might be effective only for the next trading day (Monday). I'm considering experimenting with weekly pivots, which might be more useful than the daily pivot levels. I need to consider whether I will be updating this spreadsheet daily or weekly. If you know of ways to automate the download of some of these values (trading ranges, 20, 50, 200 day SMAs, and Bollinger Bands), please contact me ASAP!
Thanks!
Ryan
Showing posts with label trading. Show all posts
Showing posts with label trading. Show all posts
Sunday, July 12, 2009
Sunday, July 5, 2009
ETF spreadsheet updated for week of July 6-10
I've updated my custom ETF spreadsheet that covers a ton of sectors, asset classes, and related Proshares/Direxion leveraged and inverse ETFs, where available.
Refer to my earlier post for instructions on how to read/interpret the spreadsheet. Do let me know if you note any errors, or would like to see changes.
Thanks!
Ryan
Refer to my earlier post for instructions on how to read/interpret the spreadsheet. Do let me know if you note any errors, or would like to see changes.
Thanks!
Ryan
Sunday, May 17, 2009
spreadsheet for trading leveraged ETFs
UPDATE June 22: Spreadsheet now online via Google docs. However, the formulas are not saved. I should be updating it semi-regularly. Still, numbers updated as of today's close, and should be helpful for trading tomorrow.
I trade the Proshares and Direxion levered ETFs. The problems associated with levered ETFs have been well documented (see "The Case Against Levereaged ETFs" by Tristan Yates and Lye Kok, located on SeekingAlpha's website).
Of particular note, technical analysis on the levered ETFs is of limited value. The levered ETFs' value have a tendency to decay of the ETFs in volatile markets makes previous price levels useless.
I'm still learning Technical Analysis (TA), and I definitely advise that one keep in mind fundamentals when using TA. (It's a valuable sanity check, though I suppose we've been in insane markets for quite some time.)
I try to do TA on index ETFs in sectors I trade frequently (in particular, financials (XLF), energy (XLE), real estate (IYR), the SPY (large caps) and IWM (small caps).
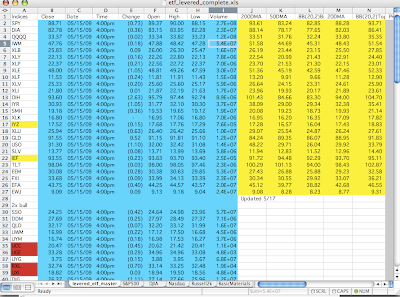
I find it is helpful to map out price levels of potential support and resistance prior to a trading day, and update them with intraday levels/trends. To calculate entry/target/stop points for my trades using the leveraged ETFs, I decided to put together a spreadsheet that automatically calculates the prices of the levered ETFs based upon the underlying (index) ETF.
Note: the index ETFs I use are not necessarily the ones that most closely track the underlying assets. Usually I chose one that more or less tracked the sector, but was most heavily traded (liquid). Unfortunately, I haven't tested how effectively the Direxion Energy Bull (ERX) and Bear (ERY) ETFs track XLE; consequently, I'm not trading energy very much.
How to use the spreadsheet
(1) Create a portfolio of the ETFs listed on the first page in a Yahoo! portfolio. I enter the ticker "BREAK" to create spaces corresponding to spaces on the spreadsheet.
(2) After the close of a trading day, download stock quotes from Yahoo.
(3) Copy and paste the field highlighted on the first page. It should match up with the format Yahoo uses.
(4) (Optional for daily; recommended for weekly) Enter in the 200, 50, 20 simple daily moving averages, as well as the Bollinger bands (I use 20 day, 2 standard deviations). I have to do this manually using stockcharts; drop me a line if you know of a better way to get SMA numbers in a spreadsheet!
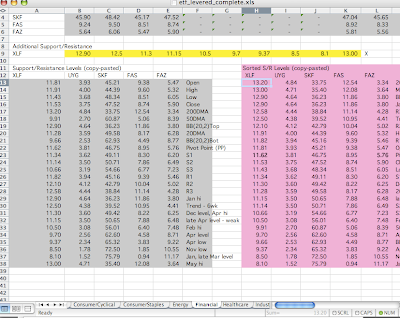
(5) For the sectors/markets of particular interest to you, I recommend adding additional price levels based on TA on the specific index ETF. Enter these numbers in the yellow boxes located on the page specific to the ETF of interest.
(6) Assuming I didn't botch the formulae, the key price levels, as well as pivots, and the corresponding levered ETF price, should be calculated in the gray box in the lower left of each sector/market sheet. I find it handy to enter in a description of what the price level corresponds to (support/resistance, hi/low/trend, as well as the time period over which it applies.) Copy and paste ONLY the values into the magenta area.
(7) Sort the data pasted in descending order of the first highlighted column (labeled by the unleveraged index ETF).
(8) You should now have an ordered set of price levels for the index, as well as the corresponding prices for the ETF.
Hope this helps. Please let me know if you've got any suggestions. I tried to make it as plug-and-chug as possible, while allowing for some customization with manually entered price levels.
NOTE: If you're interested in a copy, send me an email (ryan.yamada - at - gmail.com), and I'll be happy to email you a copy. Access to my website appears to be restricted; I'm contacting the sysadmin.


I trade the Proshares and Direxion levered ETFs. The problems associated with levered ETFs have been well documented (see "The Case Against Levereaged ETFs" by Tristan Yates and Lye Kok, located on SeekingAlpha's website).
Of particular note, technical analysis on the levered ETFs is of limited value. The levered ETFs' value have a tendency to decay of the ETFs in volatile markets makes previous price levels useless.
I'm still learning Technical Analysis (TA), and I definitely advise that one keep in mind fundamentals when using TA. (It's a valuable sanity check, though I suppose we've been in insane markets for quite some time.)
I try to do TA on index ETFs in sectors I trade frequently (in particular, financials (XLF), energy (XLE), real estate (IYR), the SPY (large caps) and IWM (small caps).
I find it is helpful to map out price levels of potential support and resistance prior to a trading day, and update them with intraday levels/trends. To calculate entry/target/stop points for my trades using the leveraged ETFs, I decided to put together a spreadsheet that automatically calculates the prices of the levered ETFs based upon the underlying (index) ETF.
Note: the index ETFs I use are not necessarily the ones that most closely track the underlying assets. Usually I chose one that more or less tracked the sector, but was most heavily traded (liquid). Unfortunately, I haven't tested how effectively the Direxion Energy Bull (ERX) and Bear (ERY) ETFs track XLE; consequently, I'm not trading energy very much.
How to use the spreadsheet
(1) Create a portfolio of the ETFs listed on the first page in a Yahoo! portfolio. I enter the ticker "BREAK" to create spaces corresponding to spaces on the spreadsheet.
(2) After the close of a trading day, download stock quotes from Yahoo.
(3) Copy and paste the field highlighted on the first page. It should match up with the format Yahoo uses.
(4) (Optional for daily; recommended for weekly) Enter in the 200, 50, 20 simple daily moving averages, as well as the Bollinger bands (I use 20 day, 2 standard deviations). I have to do this manually using stockcharts; drop me a line if you know of a better way to get SMA numbers in a spreadsheet!
(5) For the sectors/markets of particular interest to you, I recommend adding additional price levels based on TA on the specific index ETF. Enter these numbers in the yellow boxes located on the page specific to the ETF of interest.
(6) Assuming I didn't botch the formulae, the key price levels, as well as pivots, and the corresponding levered ETF price, should be calculated in the gray box in the lower left of each sector/market sheet. I find it handy to enter in a description of what the price level corresponds to (support/resistance, hi/low/trend, as well as the time period over which it applies.) Copy and paste ONLY the values into the magenta area.
(7) Sort the data pasted in descending order of the first highlighted column (labeled by the unleveraged index ETF).
(8) You should now have an ordered set of price levels for the index, as well as the corresponding prices for the ETF.
Hope this helps. Please let me know if you've got any suggestions. I tried to make it as plug-and-chug as possible, while allowing for some customization with manually entered price levels.
NOTE: If you're interested in a copy, send me an email (ryan.yamada - at - gmail.com), and I'll be happy to email you a copy. Access to my website appears to be restricted; I'm contacting the sysadmin.
Monday, March 16, 2009
AIG counterparties announced, bonuses revisited
UPDATED 3/16/2009:
The Financial Times reports AIG just announced that they have posted a list of their CDS counterparties (pdf). It's also available on the AIG website(pdf).
If my calcs are correct, here's the breakdown of where money went by region/country:
US - financial institutions: $31.5bn
US - state/municipal governments: $12.1bn
Eurozone: $37.9bn
UK: $12.7bn
Switzerland: $5.4bn
Canada: $1.1bn
Poland: $0.3bn
Not labeled: $4.1bn
Total: $105.3bn
I'm tired - I'll have to revisit these calculations later.
But this means that nearly 55% of the funds left the country.
Amazing. I thought the Eurozone banks were doing worse than our banks. They may still be, but this will definitely boost their capital.
Also courtesy of the FT; in a letter to the Treasury, CEO Liddy says that AIG targets a 30% reduction in 2009 bonuses by making use of "creative restructuring solutions". Additionally, he will propose further changes to the 2008 bonuses for Senior Partners. He cautions about a departure of top talent.
Saturday, March 14, 2009
AIG to disclose counterparties
This is big news: AIG plans to disclose CDS counterparties.
I'm a bit uncertain as to the timing of it - maybe it has to do with Treasury's increased leverage (no pun intended) with the AIG board and executives. Geithner already ordered AIG to suspend its bonus payments for 2009, and will claw back bonus payments from 2008 (Bloomberg). Maybe it has to do with the Wall Street Journal receiving a leaked document with the identities of some of the counterparties, and how much they've received.
I'm a bit uncertain as to the timing of it - maybe it has to do with Treasury's increased leverage (no pun intended) with the AIG board and executives. Geithner already ordered AIG to suspend its bonus payments for 2009, and will claw back bonus payments from 2008 (Bloomberg). Maybe it has to do with the Wall Street Journal receiving a leaked document with the identities of some of the counterparties, and how much they've received.
Subscribe to:
Posts (Atom)