Update 05/27/2009: Thanks to David Coyne for catching an error I made. I had stated that Asian-Americans were the only minority group to have voted as a majority for Proposition 8. This is false. According to a CNN exit poll, Asian-Americans were evenly split for and against Proposition 8, with a slight plurality voting no. The post has been edited to account for this.
That said, the post's intent and content remain valid; it is still troubling to me that a full 49% of Asian-Americans supported Proposition 8, given this history.
To my friends in California -
I heard about the Supreme Court ruling. And while it may have been consistent with expectations, I know it was not consistent with your hopes.
I am reminded of the many instances of separate but equal justice that California in particular, and nations in general, have visited upon their citizens.
Wednesday, May 27, 2009
Saturday, May 23, 2009
Checking your spam folder yields some gems!
I've been expecting an important email from the National Academies regarding a fellowship application. In my paranoia, I decided to check my spam folder.
Beyond the usual "enhancement" emails, I found a particular gem. Nigerian scammers appear to be adapting. :)
Sadly, for them, while the strategy is right, the grammar is still almost nonsensical. Commas, anyone?
Beyond the usual "enhancement" emails, I found a particular gem. Nigerian scammers appear to be adapting. :)
Sadly, for them, while the strategy is right, the grammar is still almost nonsensical. Commas, anyone?
Sunday, May 17, 2009
spreadsheet for trading leveraged ETFs
UPDATE June 22: Spreadsheet now online via Google docs. However, the formulas are not saved. I should be updating it semi-regularly. Still, numbers updated as of today's close, and should be helpful for trading tomorrow.
I trade the Proshares and Direxion levered ETFs. The problems associated with levered ETFs have been well documented (see "The Case Against Levereaged ETFs" by Tristan Yates and Lye Kok, located on SeekingAlpha's website).
Of particular note, technical analysis on the levered ETFs is of limited value. The levered ETFs' value have a tendency to decay of the ETFs in volatile markets makes previous price levels useless.
I'm still learning Technical Analysis (TA), and I definitely advise that one keep in mind fundamentals when using TA. (It's a valuable sanity check, though I suppose we've been in insane markets for quite some time.)
I try to do TA on index ETFs in sectors I trade frequently (in particular, financials (XLF), energy (XLE), real estate (IYR), the SPY (large caps) and IWM (small caps).
I find it is helpful to map out price levels of potential support and resistance prior to a trading day, and update them with intraday levels/trends. To calculate entry/target/stop points for my trades using the leveraged ETFs, I decided to put together a spreadsheet that automatically calculates the prices of the levered ETFs based upon the underlying (index) ETF.
Note: the index ETFs I use are not necessarily the ones that most closely track the underlying assets. Usually I chose one that more or less tracked the sector, but was most heavily traded (liquid). Unfortunately, I haven't tested how effectively the Direxion Energy Bull (ERX) and Bear (ERY) ETFs track XLE; consequently, I'm not trading energy very much.
How to use the spreadsheet
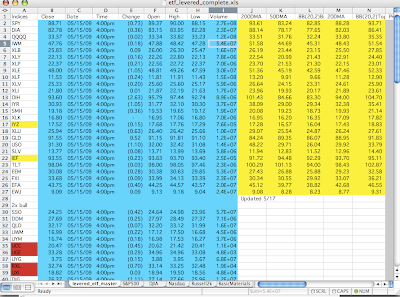
(1) Create a portfolio of the ETFs listed on the first page in a Yahoo! portfolio. I enter the ticker "BREAK" to create spaces corresponding to spaces on the spreadsheet.
(2) After the close of a trading day, download stock quotes from Yahoo.
(3) Copy and paste the field highlighted on the first page. It should match up with the format Yahoo uses.
(4) (Optional for daily; recommended for weekly) Enter in the 200, 50, 20 simple daily moving averages, as well as the Bollinger bands (I use 20 day, 2 standard deviations). I have to do this manually using stockcharts; drop me a line if you know of a better way to get SMA numbers in a spreadsheet!
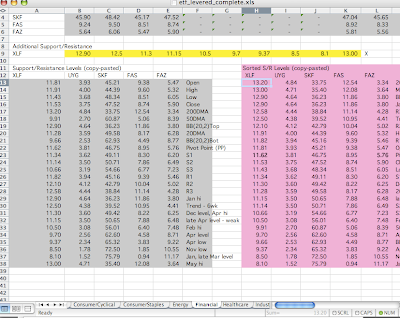
(5) For the sectors/markets of particular interest to you, I recommend adding additional price levels based on TA on the specific index ETF. Enter these numbers in the yellow boxes located on the page specific to the ETF of interest.
(6) Assuming I didn't botch the formulae, the key price levels, as well as pivots, and the corresponding levered ETF price, should be calculated in the gray box in the lower left of each sector/market sheet. I find it handy to enter in a description of what the price level corresponds to (support/resistance, hi/low/trend, as well as the time period over which it applies.) Copy and paste ONLY the values into the magenta area.
(7) Sort the data pasted in descending order of the first highlighted column (labeled by the unleveraged index ETF).
(8) You should now have an ordered set of price levels for the index, as well as the corresponding prices for the ETF.
Hope this helps. Please let me know if you've got any suggestions. I tried to make it as plug-and-chug as possible, while allowing for some customization with manually entered price levels.
NOTE: If you're interested in a copy, send me an email (ryan.yamada - at - gmail.com), and I'll be happy to email you a copy. Access to my website appears to be restricted; I'm contacting the sysadmin.


I trade the Proshares and Direxion levered ETFs. The problems associated with levered ETFs have been well documented (see "The Case Against Levereaged ETFs" by Tristan Yates and Lye Kok, located on SeekingAlpha's website).
Of particular note, technical analysis on the levered ETFs is of limited value. The levered ETFs' value have a tendency to decay of the ETFs in volatile markets makes previous price levels useless.
I'm still learning Technical Analysis (TA), and I definitely advise that one keep in mind fundamentals when using TA. (It's a valuable sanity check, though I suppose we've been in insane markets for quite some time.)
I try to do TA on index ETFs in sectors I trade frequently (in particular, financials (XLF), energy (XLE), real estate (IYR), the SPY (large caps) and IWM (small caps).
I find it is helpful to map out price levels of potential support and resistance prior to a trading day, and update them with intraday levels/trends. To calculate entry/target/stop points for my trades using the leveraged ETFs, I decided to put together a spreadsheet that automatically calculates the prices of the levered ETFs based upon the underlying (index) ETF.
Note: the index ETFs I use are not necessarily the ones that most closely track the underlying assets. Usually I chose one that more or less tracked the sector, but was most heavily traded (liquid). Unfortunately, I haven't tested how effectively the Direxion Energy Bull (ERX) and Bear (ERY) ETFs track XLE; consequently, I'm not trading energy very much.
How to use the spreadsheet
(1) Create a portfolio of the ETFs listed on the first page in a Yahoo! portfolio. I enter the ticker "BREAK" to create spaces corresponding to spaces on the spreadsheet.
(2) After the close of a trading day, download stock quotes from Yahoo.
(3) Copy and paste the field highlighted on the first page. It should match up with the format Yahoo uses.
(4) (Optional for daily; recommended for weekly) Enter in the 200, 50, 20 simple daily moving averages, as well as the Bollinger bands (I use 20 day, 2 standard deviations). I have to do this manually using stockcharts; drop me a line if you know of a better way to get SMA numbers in a spreadsheet!
(5) For the sectors/markets of particular interest to you, I recommend adding additional price levels based on TA on the specific index ETF. Enter these numbers in the yellow boxes located on the page specific to the ETF of interest.
(6) Assuming I didn't botch the formulae, the key price levels, as well as pivots, and the corresponding levered ETF price, should be calculated in the gray box in the lower left of each sector/market sheet. I find it handy to enter in a description of what the price level corresponds to (support/resistance, hi/low/trend, as well as the time period over which it applies.) Copy and paste ONLY the values into the magenta area.
(7) Sort the data pasted in descending order of the first highlighted column (labeled by the unleveraged index ETF).
(8) You should now have an ordered set of price levels for the index, as well as the corresponding prices for the ETF.
Hope this helps. Please let me know if you've got any suggestions. I tried to make it as plug-and-chug as possible, while allowing for some customization with manually entered price levels.
NOTE: If you're interested in a copy, send me an email (ryan.yamada - at - gmail.com), and I'll be happy to email you a copy. Access to my website appears to be restricted; I'm contacting the sysadmin.
Subscribe to:
Posts (Atom)